Color definitions
Visible light is a type of electromagnetic wave with a wavelength of 0.4 to 0.7 μm. Electromagnetic waves (light) that have continuous wavelengths throughout this entire wavelength range, such as ordinary light (sunlight, lighting), are colorless and transparent light.
Visible light has a distribution of colors according to wavelength.
Humans actually sense color when visible light, which has a certain wavelength distribution, sends stimuli to the brain that react to the three types of light - red, blue, and green - on the retina of the eye, and the brain recognizes these as colors.
The three stimulus values of red, blue, and green emitted from the retina are called tristimulus values, "X(λ), Y(λ), Z(λ)."
Furthermore, the relationship between X, Y, Z and wavelength is called the "color matching function."
Tristimulus values and color matching functions
The spectral sensitivity graph (color matching function graph) sensitive to the human eye is shown below.
In this, X(λ) represents the degree to which red is perceived, Y(λ) represents the degree to which green is perceived, and Z(λ) represents the degree to which blue is perceived.
The tristimulus values that humans actually perceive are determined by the light that is reflected (or transmitted) from an object and has a wavelength distribution of that color (has color characteristic), and the integral value of this color matching function (the sum of the products of X(λ), Y(λ), and Z(λ) for each wavelength).
Relationship between monitor RGB values and tristimulus values
As is clear from the color matching function graph on the previous page, the red, green, and blue that humans perceive differ from the commonly known RGB wavelength range (R=400-500nm, G=500-600nm, B=600-700nm) in that their wavelength ranges overlap and interfere with each other.
Therefore, when display measurement data from a color difference meter on a monitor, for example, a computation is required to convert it into RGB values for the monitor (R=0-255, G=0-255, B=0-255).
The conversion formula is shown below:
- R=Rr・λ1-Rg・λ2-Rb・λ3
- G=-Gr・λ1+Gg・λ2+Gb・λ3
- B=Br・λ1-Bg・λ2+Bb・λ3
λ1~λ3・・・Measurement value of wavelength filter used for color difference meter
- (λ1・・R filter wavelength data (0 to 1.000))
- (λ2..G filter wavelength data (0 to 1.000))
- (λ3..B filter wavelength data (0 to 1.000))
Furthermore, by incorporating the correction parameters when applying the RGB filter characteristic, light source lamp characteristic, light receiving element sensitivity, pre-element cut filter, and other optics characteristic of our color difference meter (visible/infrared hybrid sensor) into each of these Rr to Bb coefficients, it is possible to get closer to the color sensitivity characteristic of humans.
RGB computation formula after sensor optical characteristic correction
- R'=Rr'・λ1-Rg'・λ2-Rb'・λ3
- G'=-Gr'・λ1+Gg'・λ2+Gb'・λ3
- B'=Br'・λ1-Bg'・λ2+Bb'・λ3
There are several patterns for this parameter (9 constant) to make the colors closer to the original, but by switching between several types of parameter based on previous test data, it is possible to reproduce colors that are closer to what the human senses.
Various ways to express color and types of color systems
XYZ color system
When we see light reflected (or transmitted) from an object, cells in the retina of the eye that react to three types of light, red, blue, and green, react and send signals (stimuli) to the brain, which recognizes them as color and thus perceives color. The three stimulus values of red, blue, and green emitted from the retina are called tristimulus values "X(λ), Y(λ), Z(λ)", and the relationship between X, Y, and Z and wavelength is called the "color matching function".
RGB color system
RGB is also known as the monitor color system and is primarily used to display colors on monitors.
There are three primary colors: R (red), G (green), and B (blue), and each has a gradation of 0 to 255.
Therefore, the RGB combinations can represent a total of 256^3 = 16,777,216 possible colors.
L*a*b* color system (CIE1976L*a*b* color space
The L*a*b* color system is the most widely used for measuring color differences in color control in the industrial sector in Japan.
- L* value: brightness (luminosity) display L = 0 (black) to 100 (white)
- a* value: Red↔Green color change display a value = - side (green) to + side (red)
- b* value: display the change in color between blue and yellow. b value = - side (blue) to + side (yellow)
In addition to these, "Hunter Lab", proposed by Hunter in 1948, before the L*a*b* color system, is also commonly used.
※About color difference
To express the color difference between a certain standard color and the color being measured for comparison, the root mean square of the differences in the L value, a value, and b value (⊿L, ⊿a, ⊿b) is calculated and expressed as the color difference (= ⊿E).
When each Lab value is considered to be in three-dimensional coordinate space (x, y, z → L, a, b), the distance L between the two points of the standard color coordinates (L, a, b) and the coordinates of the comparison color (L', a', b') is defined as the color difference between the two colors (= ⊿E).
By using this color difference ⊿E as a control index, color difference control is being quantified in various industrial fields, making it possible to compare and determine standards colors, leading to improved quality.
Lovibond color system
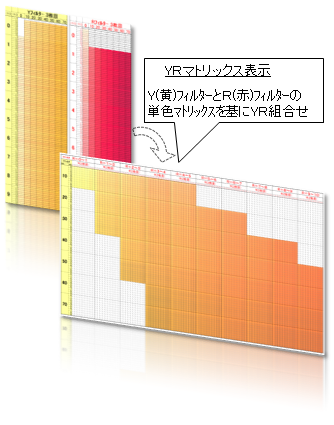
The Lovibond color display is used in many markets, including food oils and fats, chemical products in chemical plants, petroleum products, and many others, and has long been used primarily to control the color of liquids. The sample liquid is placed in a special glass cell, which is then set in the device, and the color of the sample is visually compared with the special color filter, and the color is measured by manually switching between yellow (Y) and red (R) filter until the color appears the same.
Color filter combination examples
- Y = 0.1 to 99.9 (light yellow to dark yellow)
- Y (0 digit): 0.1 to 0.9 (9 colors)
- Y (1's digit): 1 to 9 (9 colors)
- Y (tens digit); 10 to 90 (9 colors)
→Y = 9^3 = 729 colors
- R=0.1 to 99.9 (light red to dark red)
- R (0 digit): 0.1 to 0.9 (9 colors)
- R (1's digit): 1 to 9 (9 colors)
→YR combination colors = 729 x 81 = 59,049 colors
When measuring Lovibond with our color difference meter, we create a database of all filter combination data for the color range used, and then match filter measurement data with the human color perception characteristic to enable measurement of Lovibond color.
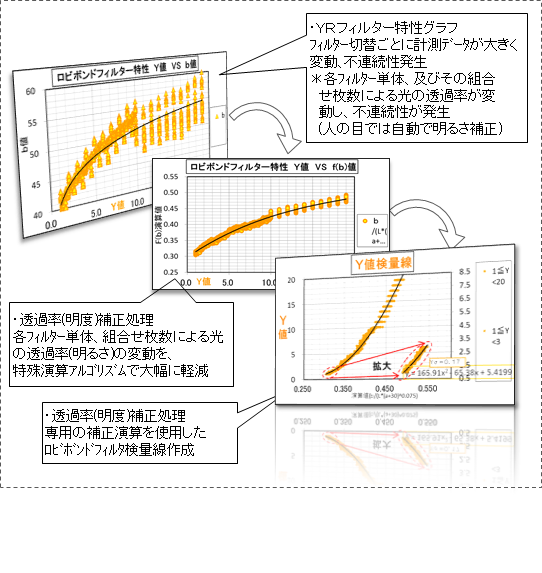
Looking at the YR filter characteristic graph, the measurement data fluctuates greatly each time the filter is switched, resulting in discontinuous characteristic. This occurs because the light transmission rate fluctuates depending on each filter and the number of filters combined. However, when measured by the human eye, the human eye has an automatic brightness correction function, so the measurement is made without any sense of incongruity (no discontinuity). Therefore, if things continue as they are, human sensations and the measured data will not match, resulting in measurement errors. To address this issue, a special computation algorithm has been used to significantly reduce the fluctuations in light transmission rate (brightness), making it possible to create a dedicated calibration curve for Lovibond filters and automatically measure Lovibond colors.
Hybrid measurement of visible (color) and infrared constituent
The visible/infrared hybrid constituent meter is a sensor that simultaneously measures visible color difference and infrared constituent. The light emitted from light source lamp is irradiated onto the sample to be measured by rotation and switching between a visible RGB filter and an infrared constituent filter at high-speed, and the reflected light is captured and measured. detecting element measures visible light and infrared light is a hybrid (composite) element that contains a Si photoelectric element for visible light and a photoconductive element such as PbS or PbSe for infrared light in one package, and each light is detected, the waveform is amplified by a preamplifier, and the signal is computation and output by signal processing.
Measurement examples
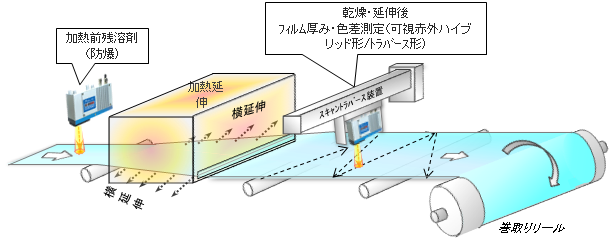
1. Film color measurement and coating agent residual constituent concentration measurement
In the film production line, various constituent immediately after drying (film thickness, moisture, residual solvent, etc.) are measured by infrared absorbance for up to three constituent, and at the same time, the color and transparency of the film are measured in real time using visible light, allowing for quality control and optimization of production conditions.
2. Measuring the color difference and constituent concentration of liquids
By attaching liquid measurement cells to the bypass piping of various liquids, the color difference and color concentration of the liquid using visible light, and the liquid constituent concentration using infrared absorbance are measured simultaneously in real time.In food production lines, Lovibond color and Lab color difference are measured, and in liquid crystal and semiconductor production lines, constituent concentration and dirt (turbidity) of chemical liquids such as etching liquids, stripping liquids, and cleaning liquids are measured in real time, and quality control, safety control (fire prevention), and operating condition control (optimization of liquid replacement by monitoring liquid dirt) are performed.
3. Measurement of powder color difference and infrared constituent concentration
It measures the color and infrared constituent of all kinds of powders, including food, chemicals, sand, and gravel.
By measuring and monitoring various color differences (Lab) using visible light, it is possible to manage operation conditions such as blend ratios in real time and optimize standard color management.
For example, in food, the concentration of constituent such as moisture, fat, and protein can be measured using infrared absorbance, while in chemistry, the concentration of moisture, residual solvents, and other contaminating constituent can be measured using infrared absorbance. It is possible to perform multiple measurements in real time at the same time as visible color measurement.