Screen list
*1 All options except (standard) are options (OP1 to OP5).
Main screen (standard)
This screen display the profile of the width direction scan data and issues traverse operation directive. It digitally display the width direction position and measurement data, and display the maximum, minimum, difference, and average data within the left and right computation range settings. It also has other functions such as overlay display and data hold. Up to three traverse devices can be connected, and by switching tabs, individual switching and multiple simultaneous display are possible. It is also possible to switch between real and smooth computation results, and display various computation results such as difference computation between each measurement data.
individual scan data screen (OP1)
display all scan data (maximum 999 scans) for one lot (one roll). For width direction data, seven scans' worth of profile data are display in different colors in the upper half of the screen, and all scan data can be viewed by switching between them using the scroll bar on the right. Each scan data can be managed by time or by winding length (m) by winding length count pulse input. Furthermore, one of the scan data can be extracted for analyzing. Scan data can also be converted to CSV (text) as an option. The lower half of the screen display flow direction trend data for three locations in the width direction or the average value of one scan. Lot data can be saved and searched for up to a maximum of 5000 lots.
Lot data computation (OP2)
The upper half of the screen shows a profile display of the Max value, Min value, and integrated Ave value in the width direction for one lot (one roll). The lower half of the screen display a graph display the trend of the Max value, Min value, Ave value, and deviation (Max-Min) for each scan in the flow direction (time axis). On this screen, for example, you can see the appearance of one roll of film.
Fixed point measurement (OP3)
With the sensor fixed at a set position (fixed point), a fixed-point trend measurement in the flow direction is performed and the fixed-point trend graph is display.
2D color pattern (OP4)
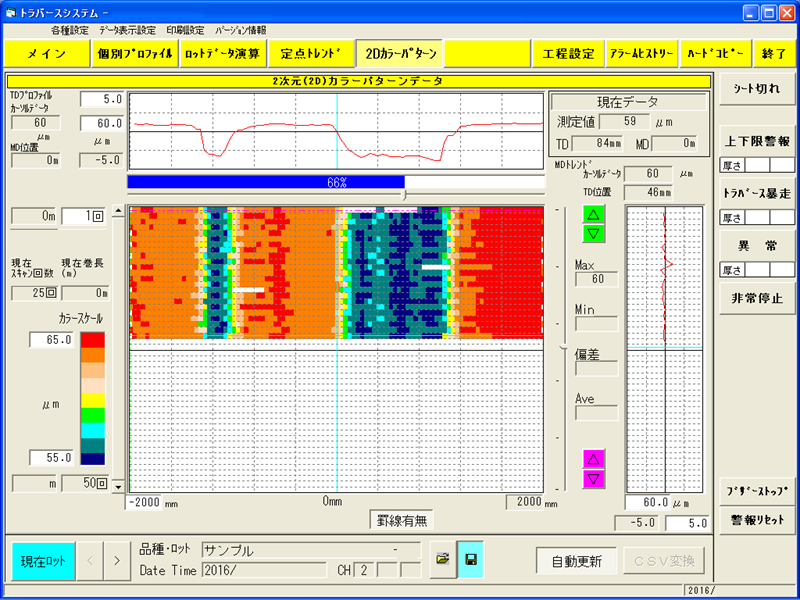
This screen shows the distribution of measurement data in the width direction and flow direction as a two-dimensional (surface) color pattern. Measurement data is display as a color pattern (arbitrary scale possible) to show thickness unevenness, moisture unevenness, etc. You can also use the cursor to designate the width direction profile cut horizontally across the surface, or the flow direction trend data cut vertically.
Streak detection, bumpy irregularity detection (OP5)
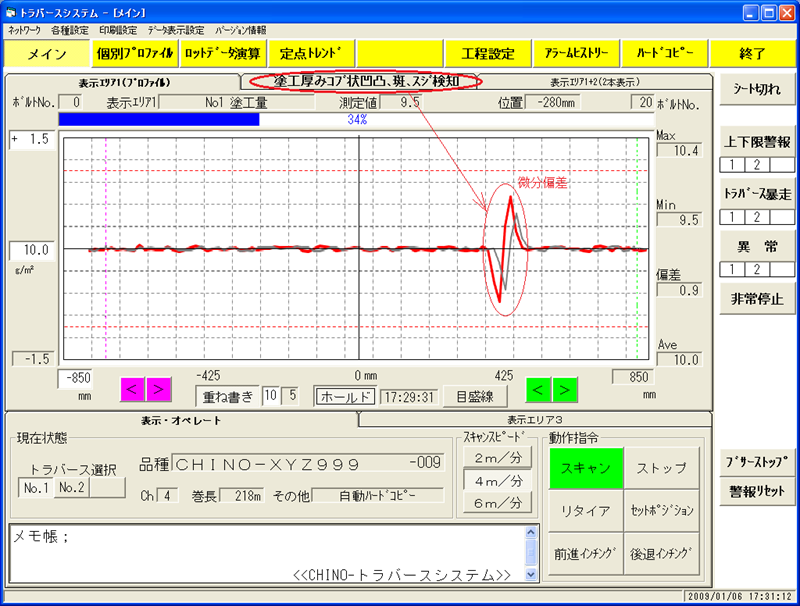
It detects streaky coating irregularities caused by foreign matter adhering to the coater machine and thickness abnormalities during film deposition (lumps, spots, irregularities).Normal higher and lower limit alarm cannot recognize specific shapes, and these abnormalities could not be detected until now, but it is now possible to detect them by using our unique computation processing, such as differential processing in the TD direction.
process setting/ product table (standard)
- In product table, information such as scan width, calibration curve number, alarm settings, and shift correction value for each product and brand can be registration for up to 200 product.
・In process setting screen, the necessary product and brand data is called up from product table and used. The current lot and the next process are display with a ●, and process can be changed manually or automatically by external contact signal.
Alarm History (OP6)
It display up to 200 records of various abnormalities such as sensor self-diagnostic abnormalities, higher and lower limit alarm, communication abnormalities, system abnormalities, etc. You can also leave a comment about the abnormality.
Help screen (standard)
When you press the button for any alarm or error lamp, a help screen will appear display the details, how to respond, and how to recover.
Creating calibration curve (OP7-1)
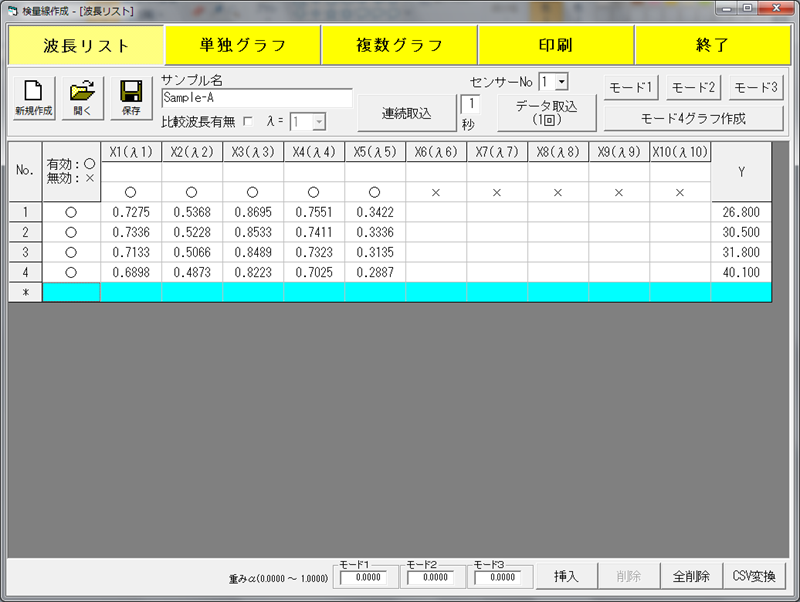
Used when creating calibration curve for a new sample. After importing each wavelength data and manually inputting the measured Y value, designate computation mode and the screen will move to the corresponding calibration curve computation / display screen.
Creating calibration curve (OP7-2)
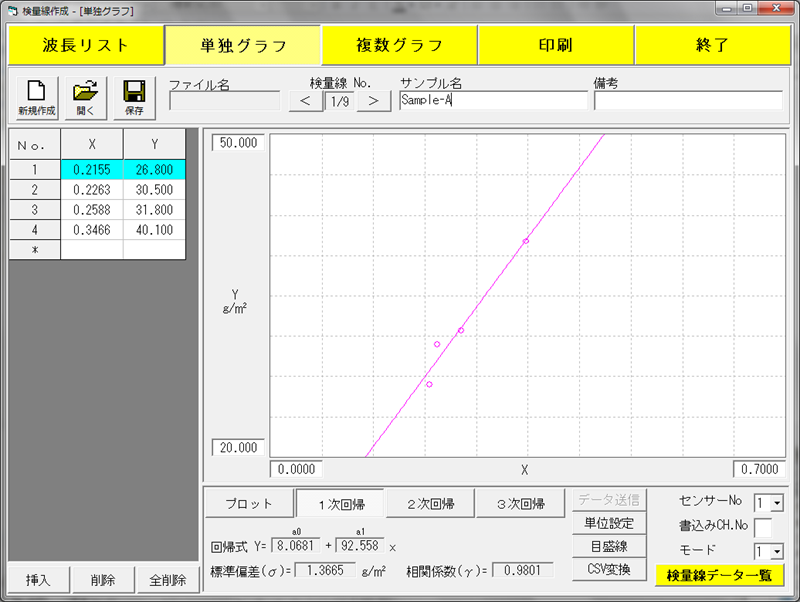
By importing wavelength data and designate computation mode, it calculates absorbance X and creates a regression equation and a calibration curve graph. It is also possible to measure multi-component using multiple regression computation using up to 10 wavelengths. The created data can also be automatically transfer to the sensor.